Tableau
The World's Leading Visual Analytics & Business Intelligence Platform — 13 Consecutive Years as Gartner Magic Quadrant Leader
Tableau is the world's leading visual analytics and business intelligence platform, enabling users to see and understand their data through interactive dashboards, powerful visualizations and AI-driven insights. Tableau was co-founded at Stanford University by three scientists and entrepreneurs passionate about data — Chris Stolte, Pat Hanrahan (2019 Turing Award laureate) and Christian Chabot — with the core philosophy that the ultimate goal of analytics is not to build a dashboard, but to truly understand the meaning behind your data.
Acquired by Salesforce in 2019, Tableau now operates as part of the Salesforce analytics and data platform. The platform serves over 120,000 customer organizations worldwide with more than 4 million community members, making it one of the most widely adopted BI tools globally. It is renowned for its unmatched visual analytics depth, intuitive drag-and-drop interface (powered by the proprietary VizQL engine), and the industry's most robust community ecosystem.
In 2024-2025, Tableau accelerated its AI integration, launching Tableau Pulse (AI-generated personalized insights), Tableau Agent (natural language visualization creation), and the Tableau Next platform featuring agentic analytics and open lakehouse architecture.
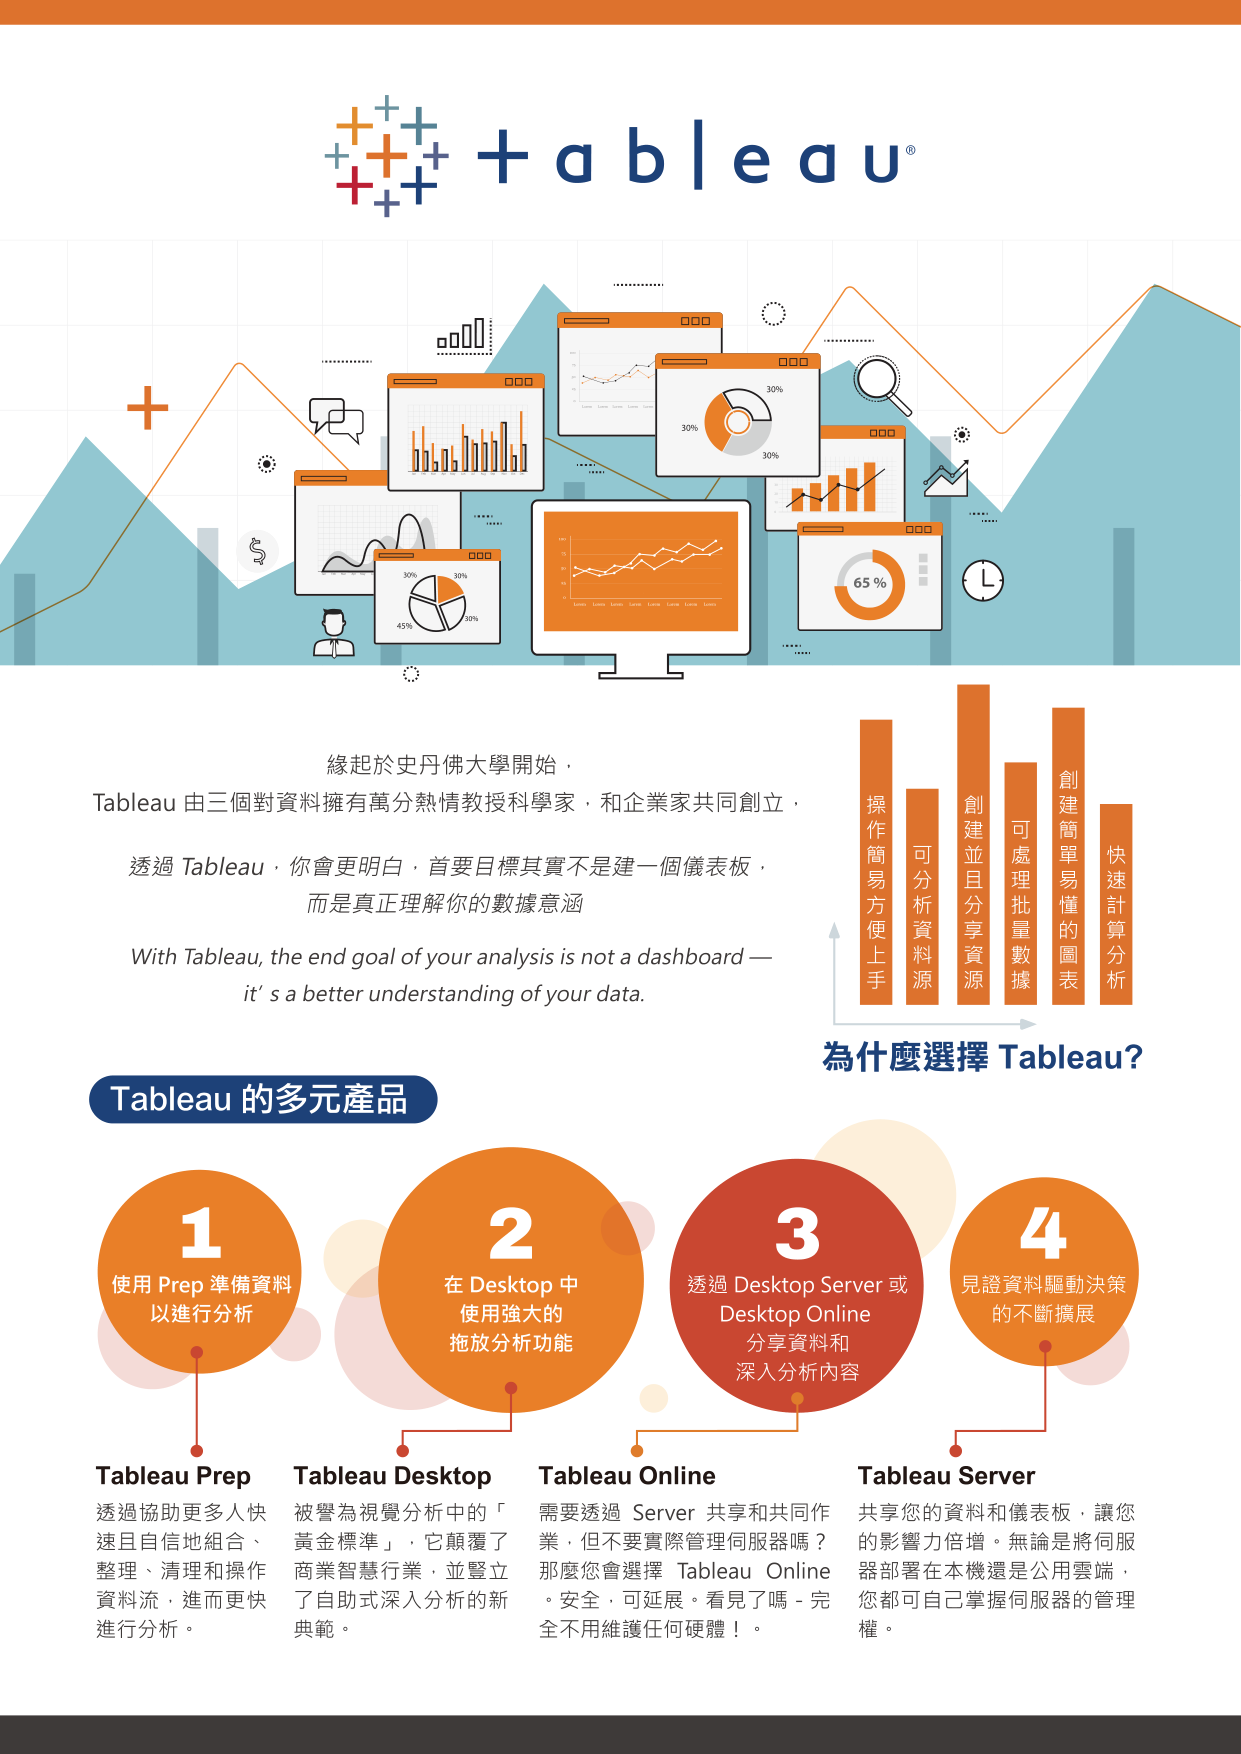
Tableau Product Overview — Intuitive drag-and-drop interface, diverse visualization charts and end-to-end analytics workflow
Product Information
| Developer | Salesforce, Inc. — San Francisco, California, USA |
| Founded | 2003 (Stanford University research; commercial release in 2004) |
| Platform Type | Desktop application (Win/Mac) + Cloud SaaS (Tableau Cloud) + On-premises server |
| Customers | 120,000+ organizations worldwide |
| Gartner Positioning | Leader — 13th consecutive year (2024 Analytics & BI Platforms Magic Quadrant) |
| User Ratings | Capterra 4.6/5 | Gartner Peer Insights 4.3/5 | G2 ~4.4/5 |
Product Portfolio
Tableau Prep
Visual data preparation tool with a direct manipulation interface for combining, cleaning and shaping data. Smart data transformation suggestions, reusable flow-based steps, and connectivity to 100+ data sources.
Tableau Desktop
The "gold standard" of visual analytics. Drag-and-drop visualization powered by the VizQL engine, automatic chart type suggestions, and interactive dashboard and report creation. Supports Windows and macOS (including Apple Silicon).
Tableau Cloud
Fully managed SaaS analytics platform with no infrastructure management required. Secure, scalable collaboration environment with Tableau Bridge for on-premises data connectivity and Tableau Pulse AI insights.
Tableau Server
Self-hosted solution deployed on-premises or in private cloud (AWS, Azure, GCP). Full control over security, governance and scaling, with support for multiple enterprise authentication methods.
Additional Products
| Tableau Pulse | AI-driven personalized insights delivered via email/Slack/in-app, with automatic metric monitoring and anomaly detection |
| Tableau Agent | Natural language AI assistant for creating/editing visualizations and writing calculations |
| Tableau Public | Free platform for creating and sharing public visualizations |
| Tableau Mobile | Native iOS and Android apps for accessing Server/Cloud dashboards |
| Tableau+ | Advanced Tableau Cloud edition with premium AI capabilities |
| Tableau Exchange | Marketplace for extensions, connectors and accelerators |
Tableau Licensing Plans — Creator, Explorer, and Viewer role-based licensing, along with success stories from Lenovo, Far EasTone and more
Core Features
Visual Analytics
VizQL Engine
Proprietary technology that translates drag-and-drop actions into optimized data queries, supporting 20+ visualization types
Interactive Dashboards
Publication-quality dashboards with interactive filters, highlights and actions. Story mode for guided narrative presentations
Viz Extensions API
Support for custom visualization types that extend the platform's visual capabilities
Data Connectivity
100+ Native Connectors
Relational databases, cloud data warehouses (Snowflake, Databricks, BigQuery, Redshift), files, cloud apps, spatial data, ODBC/JDBC
Hyper Engine
Live connections and in-memory extracts, multi-fact table relationships for complex data models, incremental extract refreshes
AI & Augmented Analytics
Tableau Pulse
AI-generated insights, metric monitoring, trend detection, anomaly alerts, delivering personalized proactive data analytics
Tableau Agent
Natural language interface for creating visualizations and calculations, lowering the barrier to analytics
Einstein AI Integration
Predictive models, GenAI capabilities, and Explain Data automated statistical explanations
Developer & Integration APIs
Embedding & REST API
Embed Tableau visualizations in web applications, programmatic access to content, users and sites
Extensions & Connector SDK
Custom dashboard/visualization extensions, build custom data connectors, Hyper API for automated extract file creation
Analytics Extensions
Integrate R, Python (TabPy), MATLAB for advanced analytics, with Webhooks for event-driven automation
Governance & Security
Enterprise-Grade Security
Row-level and column-level security, multi-factor authentication, SSO (SAML 2.0, OpenID Connect)
Data Governance
Certified data sources, data lineage tracking, Tableau Cloud Manager for multi-site management, audit logs and activity monitoring
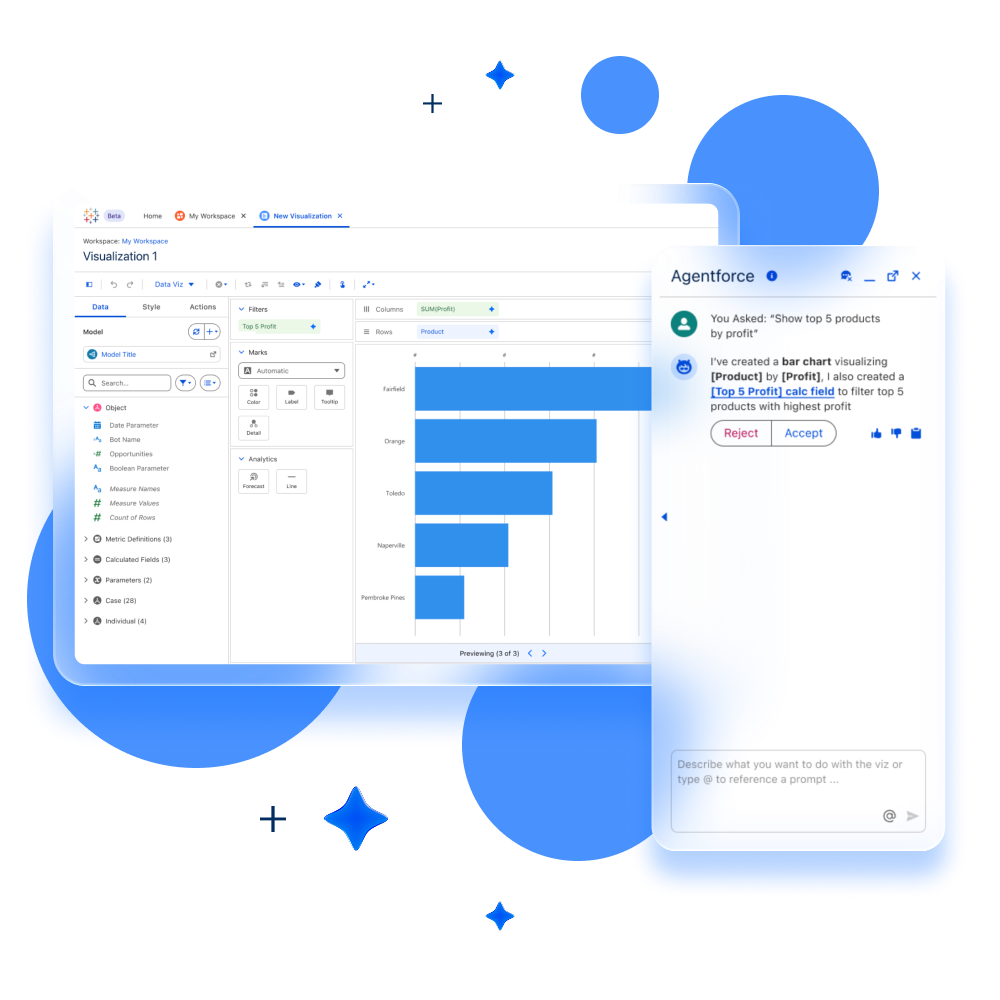
Tableau Desktop — Interactive visual analytics interface powered by the Agentforce AI assistant
Technical Specifications
Tableau Desktop
| Operating System | Windows 10+, Windows Server 2016+; macOS Monterey 12.6+ (native Apple Silicon support) |
| Architecture | 64-bit only |
| Memory | Minimum 2 GB |
| Disk Space | Minimum 1.5 GB |
Tableau Server (Production)
| Operating System | Windows Server 2016/2019/2022; Linux: RHEL 8.3+, Ubuntu 20.04/22.04/24.04 LTS, etc. |
| CPU | 8 physical cores / 16 vCPUs (recommended for production) |
| Memory | 128 GB (recommended for production); 64 GB minimum (initial node) |
| Disk | Minimum 50 GB free space (production) |
| Authentication | Active Directory, SAML 2.0, OpenID Connect, Kerberos |
| Virtualization/Cloud | Citrix, Hyper-V, VMware, AWS, Azure, GCP |
Tableau Cloud
| Access | Modern browsers (Chrome, Edge, Firefox, Safari) |
| Storage | 1 TB included |
| Languages | 14 languages supported (English, French, German, Spanish, Japanese, Chinese, Korean, Thai, Dutch, etc.) |
Application Areas
Business Intelligence & Reporting
Enterprise dashboards, KPI monitoring, and executive reporting, empowering decision-makers with real-time operational visibility.
Sales & Marketing Analytics
Pipeline analysis, regional performance, revenue forecasting (deep Salesforce CRM integration); campaign performance, customer segmentation, ROI measurement.
Finance & Operations Analytics
Revenue tracking, cost analysis, budgeting, P&L visualization; supply chain visibility, inventory optimization, quality metrics.
Healthcare & HR Analytics
Patient outcomes, clinical operations, population health analytics; workforce planning, attrition analysis, talent management.
Geospatial Analytics
Location-based insights, regional maps, logistics optimization, with built-in geocoding and spatial data support.
Data Science Integration
Model visualization, R/Python integration, predictive analytics, making data science results easy to communicate and share.
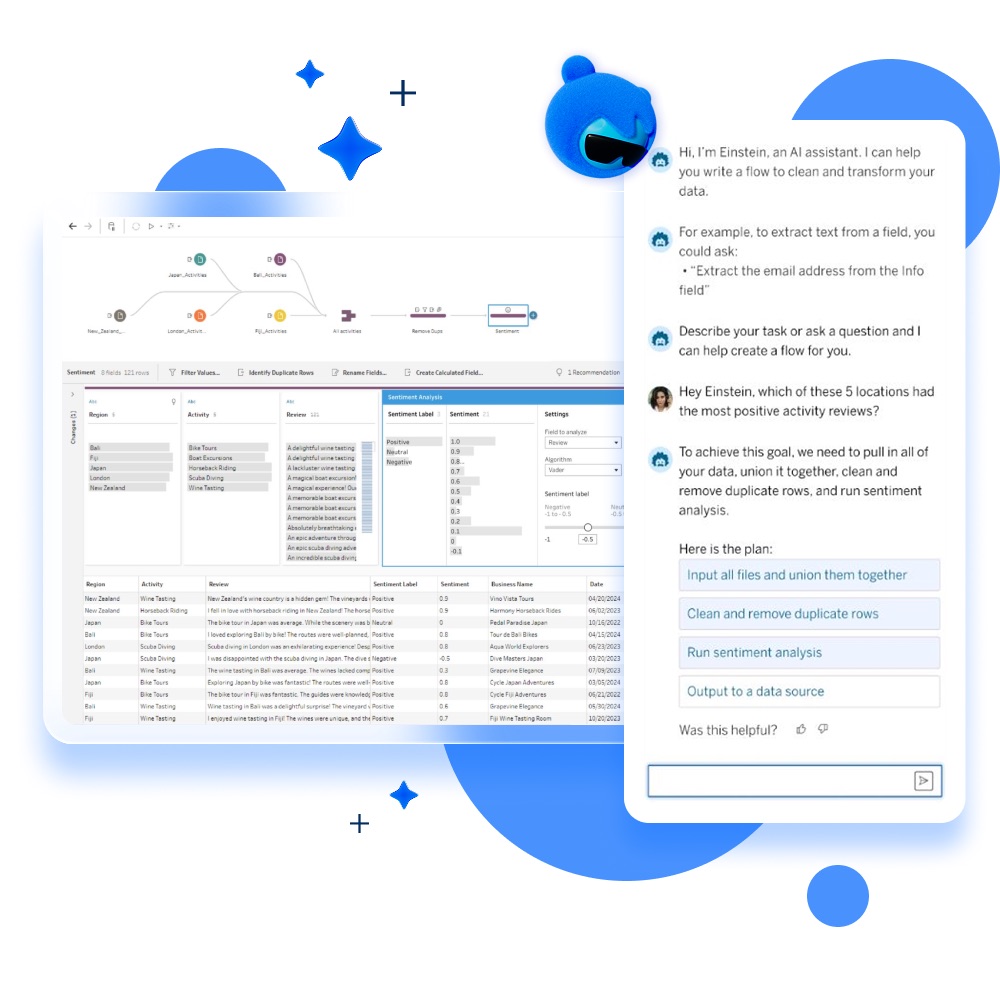
Tableau Prep Builder — Visual data flow interface for effortless data cleaning and integration
Key Differentiators
Visual Analytics Depth
Industry-leading VizQL engine, broadest range of visualization types, unmatched interactivity
13 Consecutive Years as Gartner Leader
The longest consecutive Leader record in the Analytics & BI Magic Quadrant
Largest BI Community
4 million+ members, 150+ user groups, Tableau Public, annual conference, IdeaExchange
100+ Data Connectors & AI Innovation
Broadest native connectivity; Tableau Pulse, Tableau Agent, Tableau Next agentic analytics, Einstein AI integration
Salesforce Integration & Flexible Deployment
Native CRM analytics, Data Cloud integration; supports desktop + cloud + server across Windows, Mac, Linux, and mobile
Enterprise-Scale Proven
Adopted by 120,000+ organizations; validated by large enterprises including JP Morgan Chase (30,000+ users), Verizon, Netflix
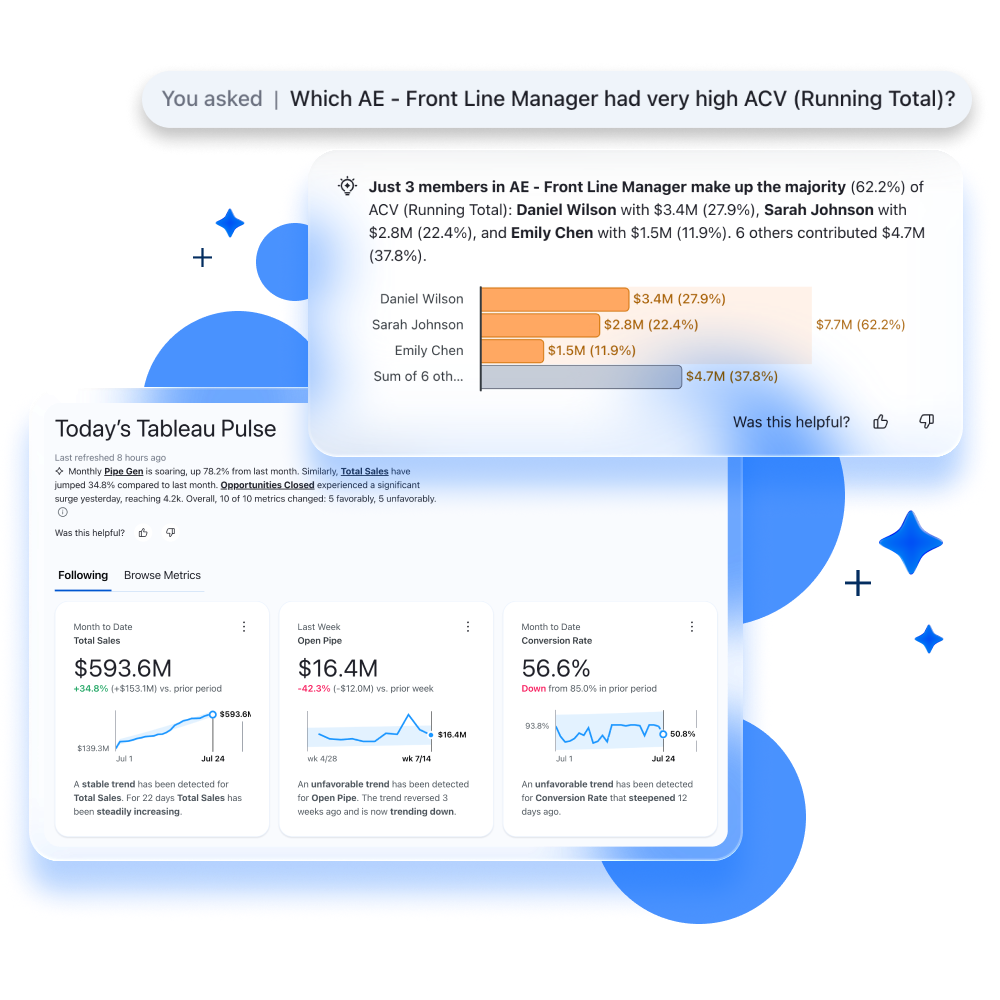
Tableau Pulse — AI-powered smart analytics dashboard that proactively delivers key insights
Customer Success Stories
Lenovo India — 95% Reporting Efficiency Improvement
| Metric | Before Tableau | After Tableau |
|---|---|---|
| Weekly Report Creation | 6-7 hours per report | Minutes (automated) |
| Report Adjustment Staff | 8-10 people | Self-service |
| Reporting Frequency | Weekly | Up to 3 times daily |
| Active Users | — | 3,000 creators / 10,000+ viewers |
Far EasTone Telecommunications (Taiwan) — 50-60% Time Reduction
Tableau Server Deployment
50 daily active users, 200+ Server viewers, 150+ roadshow training sessions across Taiwan for 500 users
50-60% Reduction in Data-to-Insight Time
Applied across call centers, finance, sales (1,000+ stores), and marketing analytics, regularly analyzing nearly 500 million records
Other Notable Deployments
| JP Morgan Chase | Grew from 400 to 30,000+ users; Center of Excellence trained 1,200 developers/analysts |
| Verizon | 1,500+ dashboards, billions of data rows, 43% reduction in call volume, 62% reduction in technical dispatches |
| Netflix | Content analytics for global streaming operations |
| Pfizer / AstraZeneca | Life sciences and pharmaceutical analytics |
| Volkswagen | Automotive manufacturing and supply chain analytics |
Company History
| Year | Event |
|---|---|
| 1999-2002 | Stanford University research: Chris Stolte, Pat Hanrahan and others develop VizQL |
| 2003 | Tableau Software founded |
| 2004 | Tableau Desktop 1.0 commercial release |
| 2013 | IPO on NYSE (ticker: DATA), stock price surged 64% on first day |
| 2019 | Salesforce acquires Tableau (largest acquisition in Salesforce history); Pat Hanrahan receives Turing Award |
| 2024 | Launch of Tableau Pulse, Tableau Agent and 24 major features |
| 2025 | Release of Tableau Next (agentic analytics, open lakehouse, AI semantic layer) |
Target Users
Business Analysts & Data Teams
Business analysts, data analysts, data scientists (visualization and communication), data engineers (Tableau Prep, data pipeline integration).
Management & IT
C-suite executives and managers (dashboard consumers), IT administrators (Server/Cloud governance), citizen data analysts (self-service BI).
Industries Served
Technology, financial services, healthcare, retail, manufacturing, telecommunications, government, higher education, non-profit, energy, life sciences, media.
Related Products
Unlock Your Organization's Potential with Data-Driven Decisions
Contact us to learn how Tableau can help your team gain insights from data
Contact Us to Learn More